
Nebraska Behavioral Risk Factor Surveillance System (BRFSS) Dashboard
Nebraska Behavioral Risk Factor Surveillance System (BRFSS) Dashboard
Background
The Behavioral Risk Factor Surveillance System (BRFSS) is a telephone health survey of adults 18 and older, conducted in all U.S. states and territories. The Nebraska Department of Health and Human Services conducts the Nebraska BRFSS each year to collect data on health behaviors, health conditions, and the use of preventive health services. BRFSS data are used to identify new and emerging health issues, establish and track health objectives, and evaluate disease prevention activities in the state.
For additional information about the Nebraska BRFSS, view the Nebraska BRFSS Website
Dashboard Overview
This Nebraska Public Health Atlas dashboard allows you to explore Nebraska BRFSS data for a variety of health topics and population groups. BRFSS results are presented in charts, tables, and maps.
This application has four tabs: Dashboard, Overview, About the Data, and User Tips. The information contained within each tab includes:
- Dashboard: BRFSS results in charts, tables, and maps
- Overview: Background information about BRFSS and the BRFSS dashboard
- About the Data: Information about the BRFSS data and statistical methods presented in the dashboard
- User Tips: Information about the functions and features in the dashboard
The dashboard is available in both desktop and mobile versions. However, the desktop version has more functions and features available for users, including the ability to compare one geographic region to another and to export content in PDF, image, and CSV formats, among other features.
The BRFSS is a random-digit dialed telephone health survey of non-institutionalized adults 18 and older. Data are collected annually by landline and cellular telephone following data collection methods established by the CDC. Within this dashboard application, BRFSS data for years 2011-2021 are presented for the State of Nebraska overall as well as by geographic region and demographic population. Additional information related to the Nebraska BRFSS can be found on the Nebraska BRFSS Website. This tab includes detailed information on the content and statistical methods presented in the dashboard.
Dashboard Indicators
There are 95 unique BRFSS indicators included in the dashboard. Some of the indicators are derived from a single survey question while others from a combination of multiple survey questions. For BRFSS data collection, each state and territory uses a standardized core questionnaire developed by the CDC, where some core questions are asked every year (fixed core) and others are asked every other year (rotating core). In addition, each state and territory can choose to add optional questions annually. In Nebraska, optional questions are added each year based on the interests and needs of public health programs and stakeholders, which vary year-to-year. As a result, within this dashboard, some indicators are available annually, some every other year (odd or even), and some for only a single year or for multiple years with no consistent administration pattern. BRFSS survey questions will, on occasion, undergo a complete revision. The revision often prevents comparability of the newly revised questions to the previous version. In some instances, indicators from both the previous and current versions of the questions are presented in the dashboard and labeled accordingly. Definitions for each indicator are available within the following link: BRFSS Dashboard Indicator Definitions
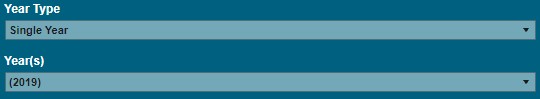
Year-Type
For each indicator, users can select to display data by single year or multi-year combined. Single year reflects the single calendar year in which the data were collected. Multi-year combined reflects a combination of two or more years in which the data were collected. Single year data allow for the selection of the most recent time-period as well as monitoring annual changes (i.e., trends); however, the number of survey respondents for an individual year can be small for some population groups, resulting in suppressed or unstable estimates. In contrast, multi-year combined data do not allow for monitoring changes over time, but do contain a larger number of survey respondents, resulting in less data suppression and more stable estimates. For this dashboard, multi-year combined data time periods were established based on the following algorithm: Within the most recent five-year time-period, all five years of data were combined if available. If all five years were not available, four years were combined if available, if not, three years were combined if available. If three or more years were not available within the most recent five-year time-period, then the most recent three years between 2011-2021 were combined if available. Finally, if only two years of data were available between 2011-2021, then those two years of data were combined. As previously noted, some indicators within this dashboard are available for only a single year. As a result, no multi-year combined data are available for these indicators.
Geographic Regions
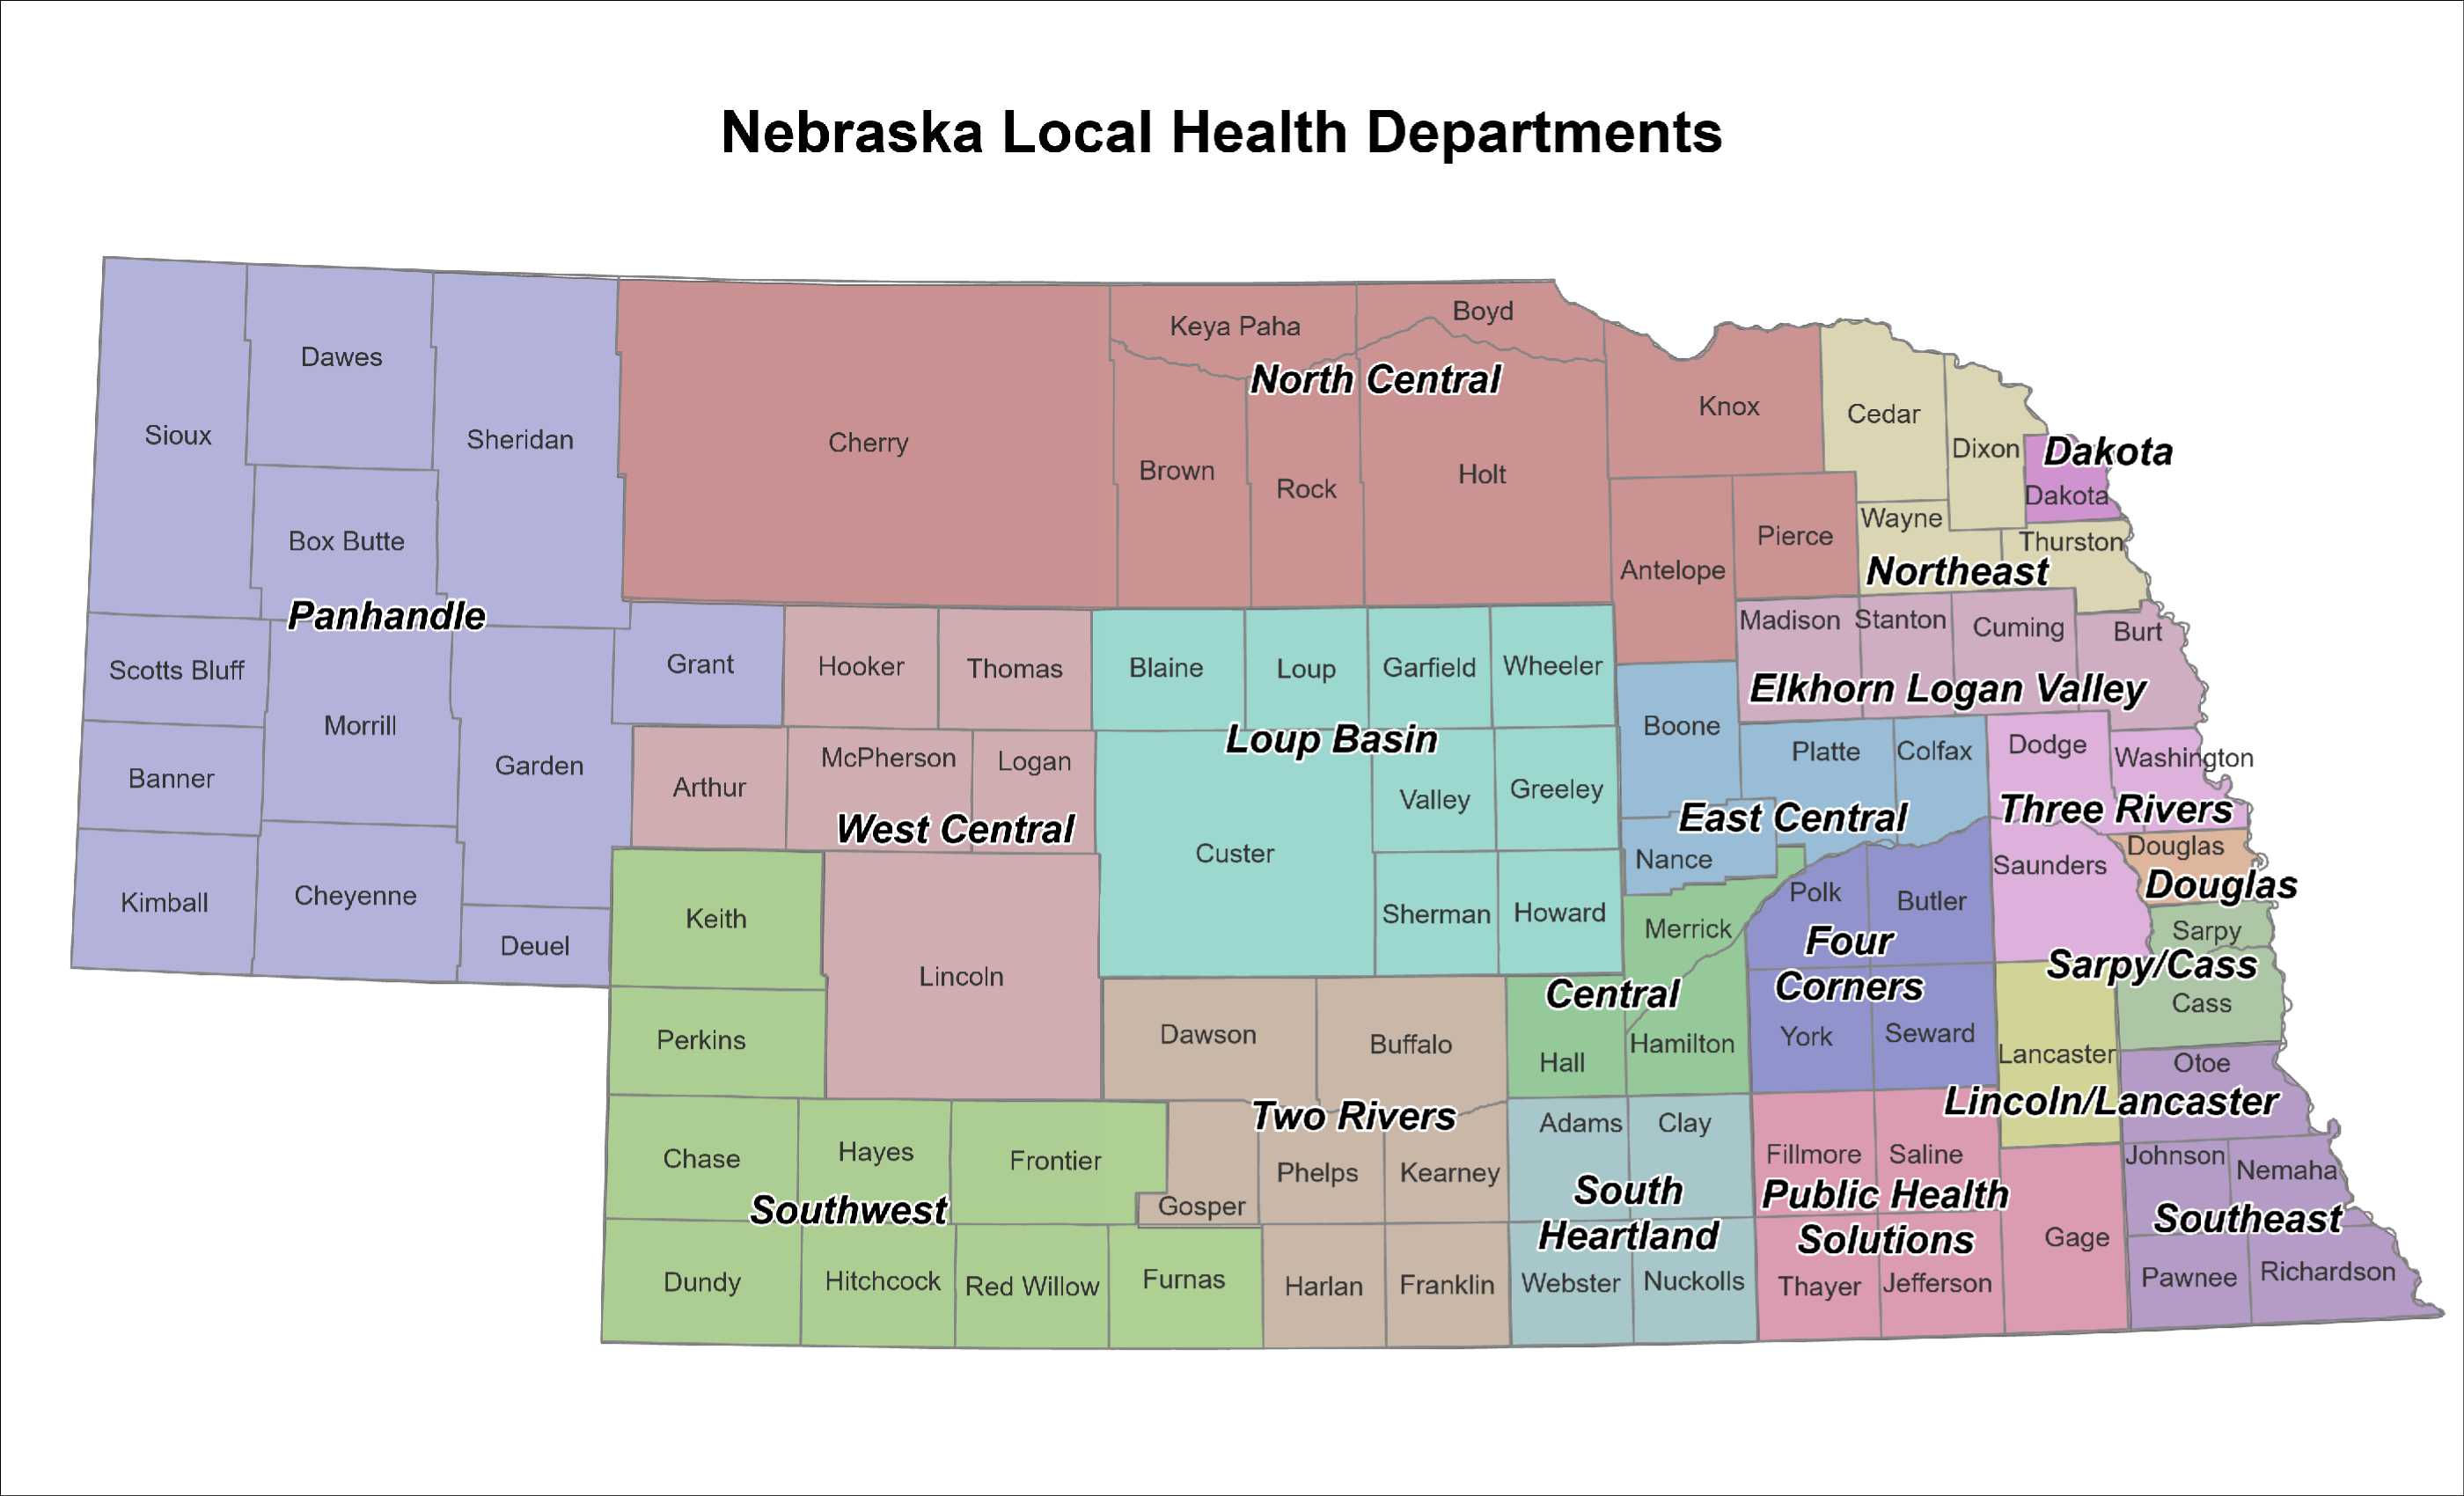
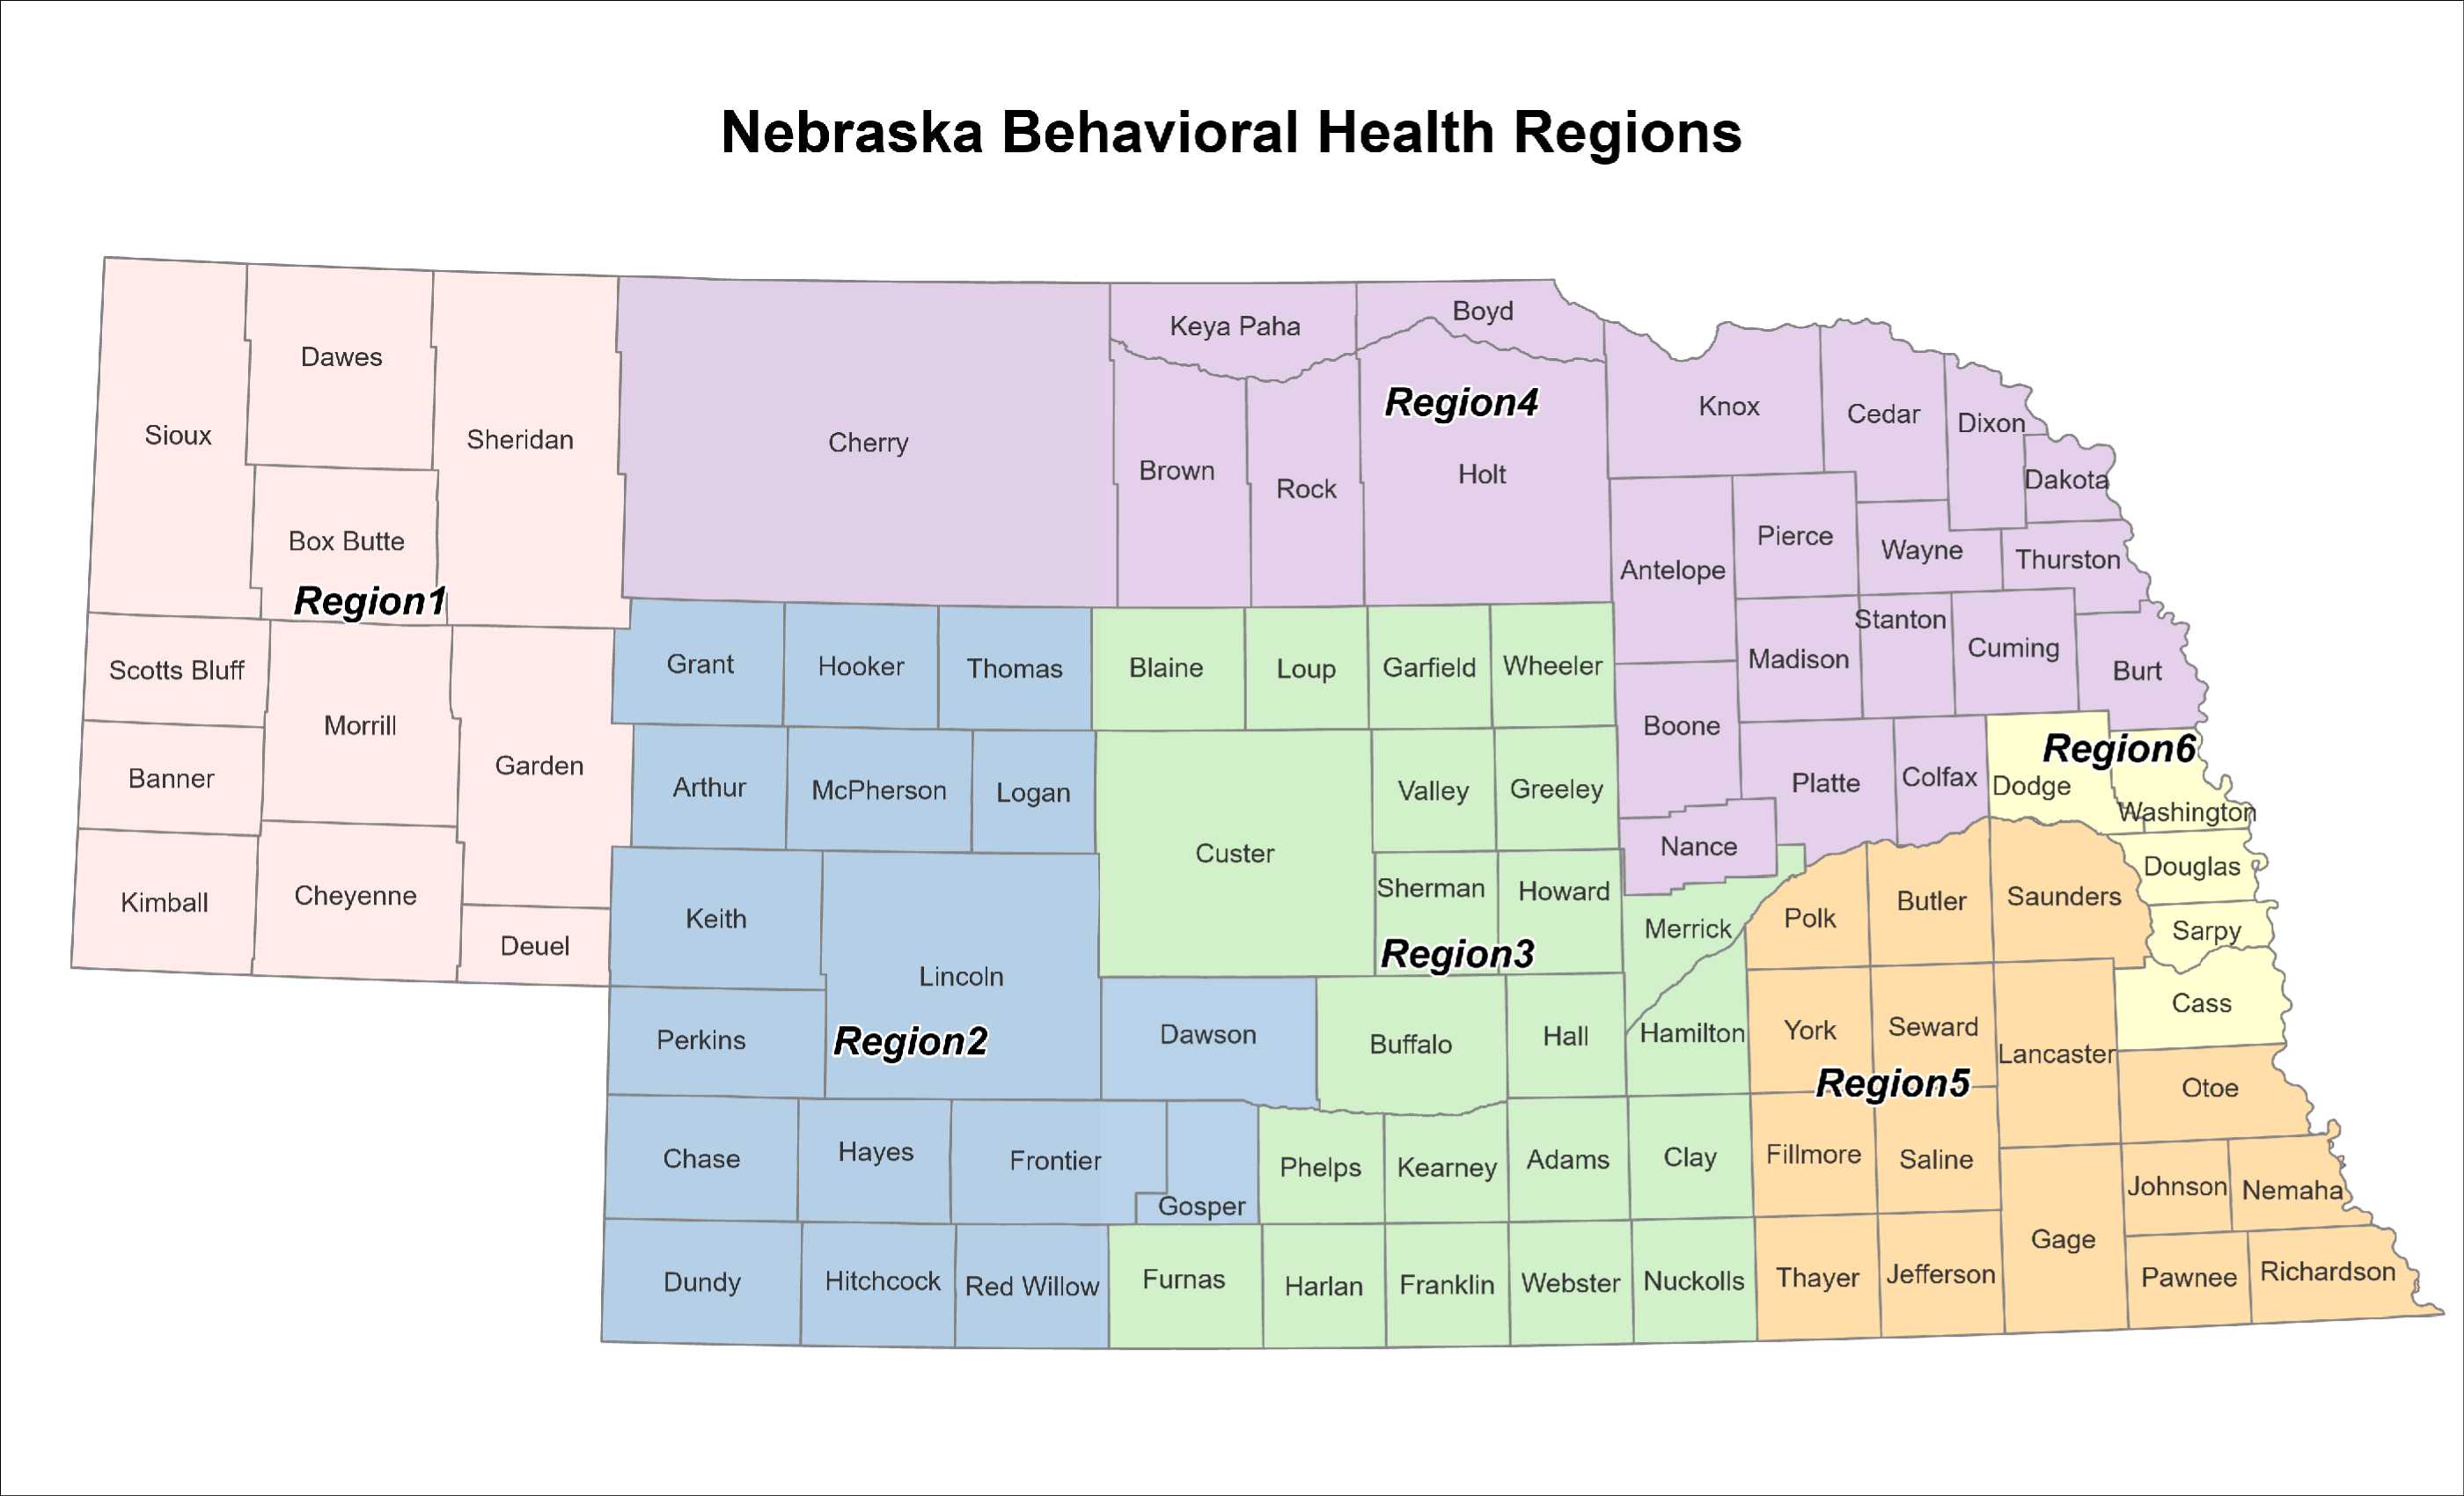
This dashboard allows for the selection and reporting of data for three geographic regions within the State of Nebraska. They include the State of Nebraska overall as well as by 19 local health department (LHD) regions and six behavioral health regions. Individual county BRFSS data are not reported by the Nebraska DHHS unless the county reflects a single county local health department. For reference, the following two maps identify which Nebraska counties are included within each of the LHD and behavioral health regions.
|
|
|---|
Urban/Rural Categorization
Results for three urban and rural categories are presented within this dashboard when State of Nebraska is selected for the geographic region. These three categories are based on “reporting category 1” within the Disparities Demographic Data Recommendations Report, Division of Public Health, NDHHS, November 2016 . The counties included within each category consist of:
- Urban‐Large (7 counties)
- Cass, Douglas, Lancaster, Sarpy, Saunders, Seward, Washington
- Urban‐Small (15 counties)
- Adams, Buffalo, Dakota, Dawson, Dixon, Dodge, Gage, Hall, Hamilton, Howard, Lincoln, Madison, Merrick, Platte, Scotts Bluff
- Rural (71 counties)
- Antelope, Arthur, Banner, Blaine, Boone, Box Butte, Boyd, Brown, Burt, Butler, Cedar, Chase, Cheyenne, Clay, Colfax, Cuming, Custer, Dawes, Deuel, Dundy, Fillmore, Franklin, Frontier, Furnas, Garden, Garfield, Gosper, Grant, Greeley, Harlan, Hayes, Hitchcock, Holt, Hooker, Jefferson, Johnson, Kearney, Keith, Keya Paha, Kimball, Knox, Logan, Loup, McPherson, Morrill, Nance, Nemaha, Nuckolls, Otoe, Pawnee, Perkins, Phelps, Pierce, Polk, Red Willow, Richardson, Rock, Saline, Sheridan, Sherman, Sioux, Stanton, Thayer, Thomas, Thurston, Valley, Wayne, Webster, Wheeler, York
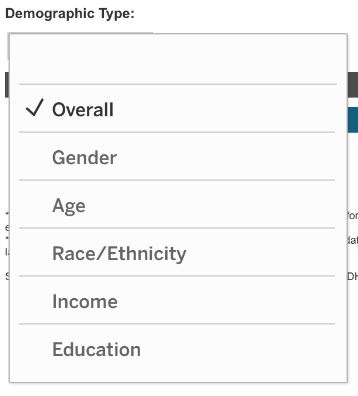
Dashboard Demographics
- Gender
- Gender is presented as male and female based on self-reported sex.
- Age
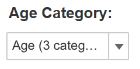
- Age is presented in age categories based on self-reported age in years. For most indicators, age is available for display in standard three, five, seven, and eight age category groupings. For indicators representing a sub-group of adults based on age (e.g., flu vaccination among persons 65 and older), fewer, and in some cases different, age categories are available for display.
- Race/Ethnicity
- Race/ethnicity is presented in two ways: individual race/ethnicity categories as well as general race/ethnicity categories. The individual categories include: White, non-Hispanic; Black, non-Hispanic; American Indian, non-Hispanic (including Alaska Native); Asian, non-Hispanic (including Pacific Islanders), Other, non-Hispanic; Multi-Racial, non-Hispanic (those who self-identified as more than one race), and Hispanic (including Hispanic or Latino). The general categories include White, NH and minority. It should be noted that Other, non-Hispanic results were excluded from individual reporting within this dashboard due to the small number of survey respondents and resulting large amount of data suppression. The Minority category presented in this dashboard includes all seven of the individual race/ethnicity categories noted above except for White, non-Hispanic. While the BRFSS asks separate questions about race and ethnicity, a cross-tabulation of those questions was used for analysis and reporting of data within this dashboard. This allows each BRFSS respondents to be grouped into one single race/ethnicity category for data reporting. When calculating the individual race/ethnicity categories, if a BRFSS respondent self-identified as Hispanic they were coded as Hispanic regardless of their selected race. In contrast, if a respondent self-identified as non-Hispanic they were coded as their selected race and as non-Hispanic.
- Household Income
- Household income is presented in four categories based on self-reported annual household income from all sources. These four categories include: Less than $25,000; $25,000-$49,999; $50,000-$74,999; and $75,000 or more.
- Educational Attainment
- Educational attainment is presented in four categories based on the self-reported highest grade or year of school completed. These four categories include: Less than H.S. (either never attended school, only attended kindergarten, or completed any grades 1-11); H.S. or G.E.D. (completed grade 12 or obtained a G.E.D.); Some Post-H.S. (completed 1-3 year of college or technical school); and College Graduate (completed 4 or more years of college).
Dashboard statistics
The following statistics are presented for each indicator within this dashboard:
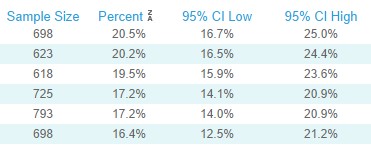
- Non-weighted sample size
- Reflects the actual number of BRFSS survey respondents (denominator) for the selected time-period, indicator, geographic, and demographic population.
- Weighted percentage or mean
- Reflects the weighted population estimate for the selected time-period, indicator, geographic, and demographic population. (see “weighting” for further details)
- 95% CI low and high
- Reflects a range around the weighted estimate in which the true population prevalence is likely to occur. BRFSS estimates are derived from surveying a sample of adults as opposed to all adults in the population (i.e., a census). As a result, population estimates are generated. Confidence intervals (CI) are statistics generally presented along with population estimates when reporting survey data. This dashboard contains 95% confidence intervals, indicating 95% confidence that the interval range contains the true population value. Increases in sample size typically reduce the confidence interval range, suggesting more confidence in the results. For BRFSS data, confidence intervals are asymmetric, meaning they do not extend evenly above and below the percentage estimate, especially as the percentage gets close to 0% or 100%.
Weighting
Beginning in 2011, iterative proportional fitting (i.e., raking) succeeded post stratification as the BRFSS statistical weighting method. Raking accounts for age, sex, categories of ethnicity, geographic regions within states, marital status, education level, home ownership and type of phone ownership as part of the weighting process. All data presented within this dashboard were weighted to enhance the representativeness of the data.
Data Suppression
Although the overall number of respondents in the Nebraska BRFSS is sufficiently large for statistical inference purposes, subgroup analyses (demographic and geographic) can lead to unreliable estimates. As a result, BRFSS data are suppressed and footnoted using the following rules: (1) estimates are fully suppressed if there are fewer than 50 respondents in the denominator; (2) estimates are footnoted as unstable if the relative standard error is >30% or the 95% CI half-width is >10 percentage points.
Age-Adjustment
Age adjustment is an analytical technique used in public health to compare estimates between population groups with different age distributions and over time. Within this dashboard, BRFSS data for race/ethnicity, income, education, and urban/rural were age-adjusted using direct age-adjustment. This was done to reduce the influence of age when comparing differences between demographic categories. The 2000 Projected U.S. Population served as the standard population for age-adjustment, which is consistent with the National Center for Health Statistics’ current recommendation. The most common standard population used within this dashboard was age‐distribution 9, noted within the January 2001 Klein and Schoenborn publication on age‐adjustment . While most indicators within this dashboard reflect both genders and all persons 18 and older, some reflect only females and/or only certain age groups. In those instances, the standard population used was different.
Statistical Analysis
The results in this dashboard may be slightly different than results in previously published reports and tables containing Nebraska BRFSS data. This may be due to differences in the software used, how the statistical analysis was conducted, how the indicators were calculated, or the suppression rules that were used. The data results within this dashboard were analyzed using SAS and SAS-callable SUDAAN software.
BRFSS Limitations
BRFSS data are subject to numerous limitations, similar to any population-based survey. Participation in the BRFSS is voluntary and the data are self-reported, which can lead to non-response, recall, and social desirability bias. Furthermore, the BRFSS only targets non-institutionalized adults who are able to complete the interview unassisted by telephone in English or Spanish. Lastly, there may be a small sample for some populations, resulting in data suppression or instability.
This tab includes information about the functions and features of the mobile version of the dashboard, located in the Dashboard tab.
Filtering Selections
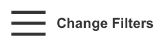
At the top of the screen, there is a Change Filters button:
|
|---|
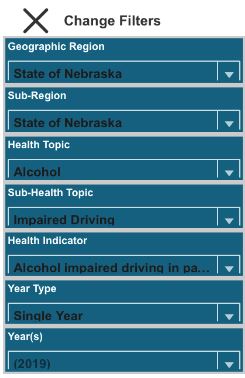
If you click on the three stacked lines, seven selection fields appear on the screen, including:
- Geographic Region
- Sub-Region
- Health Topic
- Sub-Health Topic
- Health Indicator
- Year Type
- Year
Each field is populated by default, but can be changed at any time. When changing one field you may notice a bracket around values within other fields. The bracket indicates that a valid selection is needed for that field before data will display. In the example below, “Year(s)” would need to be changed to a valid selection option.
|
|---|
If you select the X next to Change Filters, it will remove the change filter drop-down options.
Selected Health Indicator Display
The selected health indicator appears below the change filters button at the top of the dashboard. The indicator listed in this section aligns with the filtering selections made, and will change as different indicators are selected. Note that the indicators included within the dashboard and their associated definitions can be found within the About the Data dashboard tab.

|
|---|
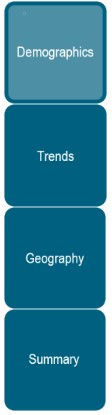
Primary Navigation
The larger vertical tabs on the left side of the dashboard (Demographics, Trends, Geography, Summary) are the primary navigation tabs. When a primary navigation tab is selected, data specific to that category are displayed, and further navigation options become available.
|
|---|
Secondary Navigation
Under the primary navigation tabs, are the secondary navigation selection options. These drop-down selection options allow you to switch between different demographic and geographic categories. Note that these tabs are not available within the Trends navigation tab.
|
|---|
Changing Age, Race/Ethnicity, and Geographic Region Categories
Use the drop-down selection boxes to change the categories displayed for age, race/ethnicity, and geographic sub-region in their associated secondary navigation tabs. Note that for the age panel, not all indicators have the same number of age category options since some indicators cover only a sub-set of adults (e.g., adults 45 and older).
|
|---|
This tab includes information about the functions and features of the dashboard, located in the Dashboard tab.
Filtering Selections
Under the Dashboard tab, there are seven selection fields at the top of the screen, including:
- Geographic Region
- Sub-Region
- Health Topic
- Sub-Health Topic
- Health Indicator
- Year Type
- Year
Each field is populated by default, but can be changed at any time. When changing one field you may notice a bracket around values within other fields. The bracket indicates that a valid selection is needed for that field before data will display. In the example below, “Year(s)” would need to be changed to a valid selection option.
|
|---|
Selected Health Indicator and Definition Display
The selected health indicator and indicator definition appear below the selection fields at the top of the dashboard. The indicator and definition in this section align with the filtering selections made, and will change as different indicators are selected.

|
|---|
Primary Navigation
The larger vertical tabs on the left side of the dashboard (Demographics, Trends, Geography, Summary) are the primary navigation tabs. When a primary navigation tab is selected, data specific to that category are displayed, and further navigation options become available.
|
|
|---|
Secondary Navigation
The smaller horizontal tabs to the right of the primary navigation tabs are the secondary navigation tabs. These tabs allow you to switch between different demographic and geographic categories. Note that these tabs are not available within the Trends navigation tab.

|
|---|
Adding a Comparison Group
To add a comparison group for Demographic and Trend results, select a geographic comparison region and the values for that region will appear in both charts and tables. The selected comparison region will be applied to all demographic groups. To unselect a comparison region simply select “None” and the comparison data will be removed.

|
|---|
Changing Age, Race/Ethnicity, and Geographic Region Categories
Use the drop-down selection boxes to change the categories displayed for age, race/ethnicity, and geographic sub-region in their associated secondary navigation tabs. Note that for the age panel, not all indicators have the same number of age category options since some indicators cover only a sub-set of adults (e.g., adults 45 and older).

|
|---|
Exporting
There are three options for exporting content from the dashboard. These include PDF, image (png), and CSV formats. The PDF and image options can be exported by clicking on the corresponding icons under the primary navigation buttons on the left of the screen. These exports include the entire content of the dashboard screen. Data from the tables can be exported by clicking on the CSV icon located in the top right corner of each data table. These exports include only the data displayed within that particular table.
|
|
|---|
Sorting Data within Tables
Data within tables can be sorted in ascending or descending order by clicking to the right of the column label within a table.
|
|---|
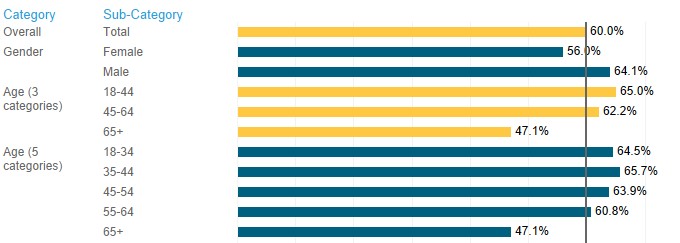
Summary Tab
The Summary tab only contains data already presented within other sections of the dashboard. However, it contains a large amount of data in a single view for quick review. Each chart contains a vertical line and alternating colors for the bars. The vertical line reflects the overall value for the selected geographic region (in Demographic Summary) and the overall value for the State of Nebraska (in Geographic Summary). The colors in the chart separate the category/region groupings from one another.
|
|---|
- For additional information about the Nebraska BRFSS, view the Nebraska BRFSS Website
- Additional information about the BRFSS can also be found on the CDC BRFSS Website